Elliott Waves
Theory
Ralph Elliott (1871–1948) was an accountant, who developed a stock market theory based on symmetrical price cycles. He published his wave theory in two books (1938 & 1946) and believed that Man and the Universe are subject to cyclical processes which can be calculated and projected with certainty far into the future. His work was popularised by Robert Prechter who revised it in his own book called “The Elliott Wave Principle.”
The basis of the theory is that prices advance in three upwaves, followed by two downwaves. The downwave is steeper and of shorter duration than the upwave. These waves are always symmetrical and can be seen in all timeframes.
- Grand Supercycle -
100- 200 years - Supercycle -
40- 70 years - Cycle -
1- 5 years - Primary -
3 months to 2 years - Intermediate -
weeks/months - Minor -
weeks - Minute -
days - Minuette -
hours - Sub-
minuette - minutes
Trading Strategy
Trading signals are derived from the price chart. Buy the start of the upward or impulse wave. Sell at the third peak of the upwave. Buy again at the lowest point of the downwave. The hardest part of the theory is to determine and measure the waves accurately -
How to buy shares with technical analysis
Technical Analysis theory is based on the premise that the share price reflects all available information about a company and its future prospects -
- Chart patterns
- Elliott waves
- Indicators
- Japanese candlesticks
- Volume analysis

Log charts
Share prices are usually drawn as a “log chart.” Price is plotted on the Y-

Sell -


Buy rise from consolidation area
Buy -
Buy -
Buy -
Buy -
Buy -
Buy -
Sell fall from consolidation area
Sell -
Sell -
Sell -
Sell -
Sell -


Head
Shoulder
Shoulder


Shoulder
Shoulder
Head

More technical analysis methods are listed below.
Chart Patterns
Theory
Share prices often display repetitive trends and patterns. After a strong move upwards, prices often move sideways -
Trading Strategy
Trading signals are derived from a log price chart. The trading plan is to buy at the low point of a bottoming pattern and sell at the high point of a topping pattern. Another strategy involves the consolidation area -
An Elliott Wave comprises 3 upwaves and two downwaves.

Buy
Buy
Sell


Technical Analysis Indicators
There are about 300 technical analysis indicators. They comprise a short mathematical formula based on the daily share price -

Directional Movement Index (DMI)
Theory
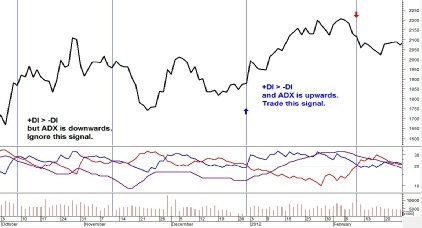
DMI is a popular indicator. It was developed by J. Welles Wilder in 1978 to describe the current price trend, as up, down, or sideways. It is an unique indicator because it combines two price swing components. The first relates to up-
- Plus Directional Indicator +DI
- Minus Directional Indicator -
DI - Average Directional Movement Index ADX
In the above chart, the share price is the top black line with volume bars along the bottom. The central area shows the three DMI lines: +DI is blue, -
Trading Strategy
A buy signal is generated when +DI crosses above -